Independent satellite signals on US crop supply.
Traders running WASDE-based supply models are working from the same consensus data as the rest of the market. Terraxiq provides field-level NDVI yield estimates derived directly from satellite observations — orthogonal to USDA survey methodology, updated every 5 days throughout the growing season, available 6 weeks before each WASDE print.
What consensus data misses.
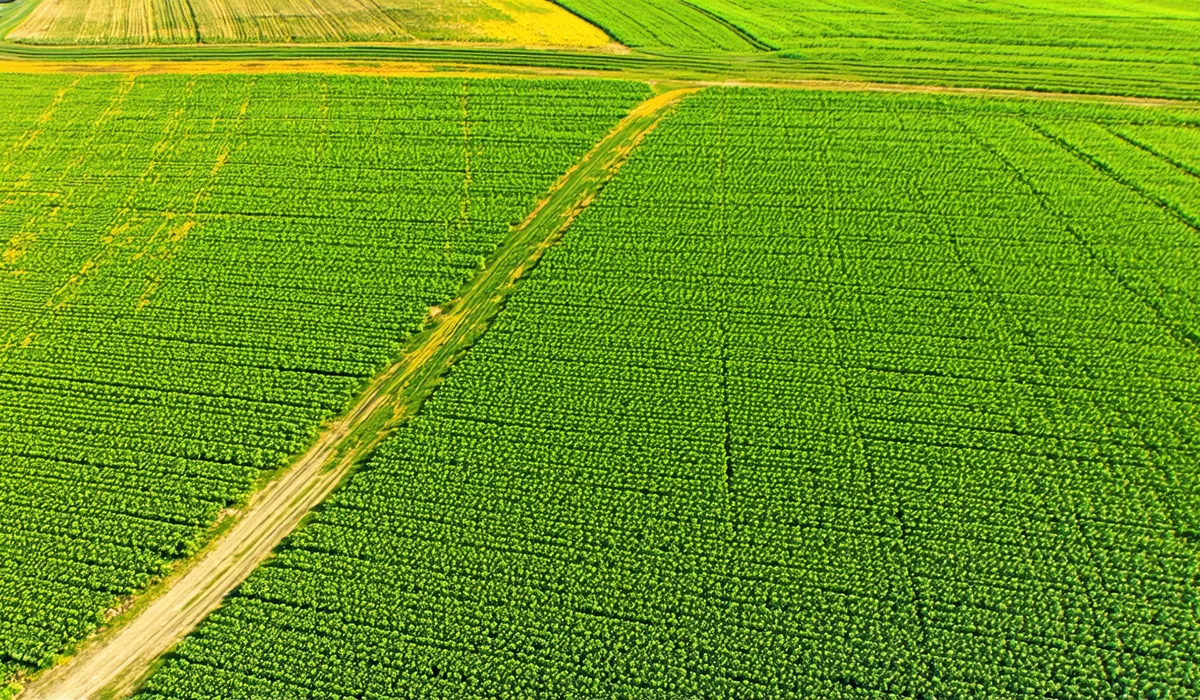
USDA crop condition surveys aggregate subjective state agronomist observations weekly. WASDE publishes monthly national balance-sheet estimates. Weather-based crop models are indirect proxies calibrated at state level. Terraxiq reads actual crop canopy reflectance from orbit — NDVI, EVI, and red-edge biomass indices at 10-meter field resolution, updated every 5 days, not waiting for a survey.
Signals structured for trade desk consumption.
Terraxiq produces quantitative outputs ready for quant model ingestion — probability distributions, state-level supply aggregates, and NDVI anomaly flags. Not raw GeoTIFF imagery that requires an imagery analyst to interpret.
National Supply Trajectory
Aggregate field-level P50 yield estimates into state and national crop supply forecasts — corn, soybean, winter wheat, spring wheat. Compare satellite trajectory to USDA crop condition ratings and prior-year WASDE baselines to identify early divergence signals for futures positioning.
NDVI Anomaly Flags
NDVI z-scores computed against 8-year historical baselines at Crop Reporting District level. Stress anomalies and green-up recovery signals delivered as structured API flags — updated every 5 days, available before market open. Designed for automated ingestion into trading signal pipelines.
Yield Trajectory Index
Intra-season yield trajectory expressed as a deviation from 8-year trend — by state and crop type. Quantified uncertainty as P10/P50/P90 spread. Built for basis trading, calendar spread strategies, and pre-WASDE positioning in corn and soybean futures.
How trading desks integrate Terraxiq.
API Key + Crop Selection
Activate API access. Select which crop regions and states you want covered (corn belt, plains wheat, delta soy).
Pull National Yield Estimates
Every 5 days, pull aggregate national and state yield estimates from the REST endpoint. JSON output maps to your data lake schema.
Build Signal Models
Layer Terraxiq NDVI anomaly and yield trajectory signals on top of price models. Backtest vs. WASDE report surprises on 8 years of history.
Receive Mid-Season Alerts
Flag unusual stress events or weather recovery signals automatically. Get notified before open market sessions when satellite anomaly thresholds breach.
Evaluate one growing season.
Trial Terraxiq on Corn Belt coverage for the upcoming growing season. Receive 5-day NDVI anomaly flags and national supply trajectory estimates throughout the season. Compare aggregate P50 estimates to WASDE actuals at season close and measure signal quality before committing to an annual subscription.