185 million acres. 5-day refresh. Field-level output.
CONUS cropland monitoring across corn, soybean, winter wheat, and spring wheat production zones — from two Sentinel-class satellite constellations processed through temporal compositing, CLU-matched field boundary delineation, and gradient-boosted yield modeling. Delivered via REST API at 5-day cadence throughout each growing season.
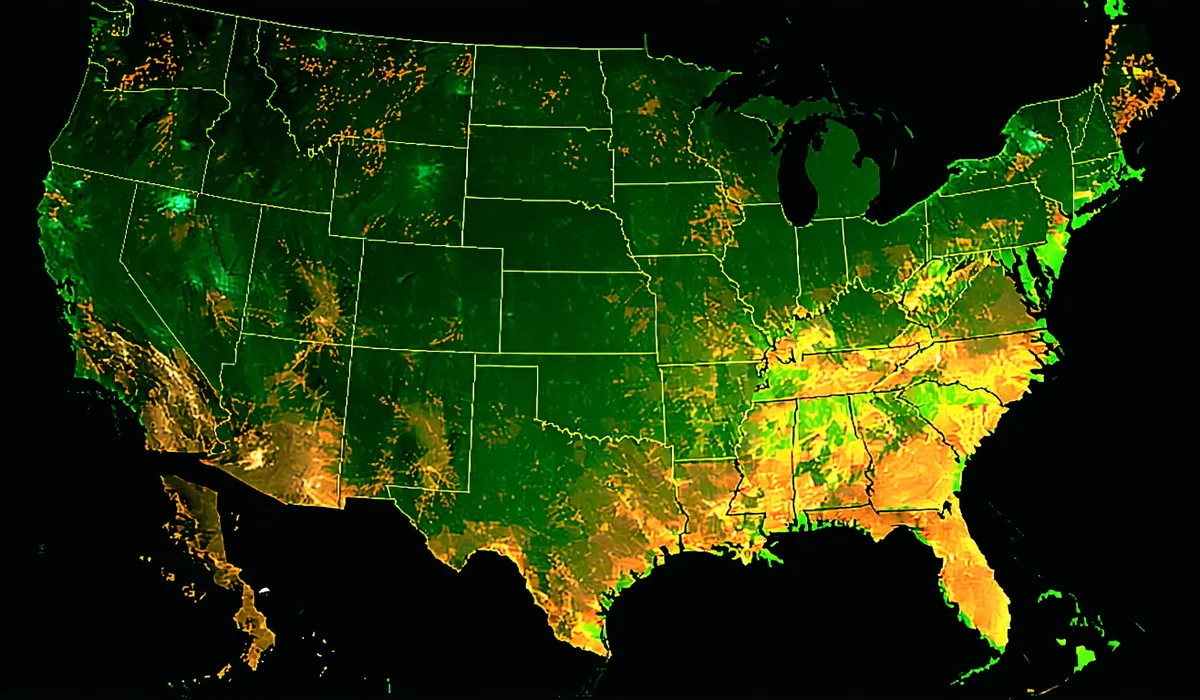
Crop-Type Coverage Regions
Three agroecological zones with crop-type-specific model calibration, separate growing season windows, and CLU-matched field boundary delineation per region.
Corn Belt
Iowa, Illinois, Indiana, Ohio, Minnesota, Missouri. Primary corn and soybean growing zone. Full season monitoring from emergence to harvest.
- Crops: Corn, Soybean
- Season: May – October
- Field delineation: CLU-matched boundaries
Great Plains Wheat
Kansas, Nebraska, Oklahoma, South Dakota, North Dakota. Winter and spring wheat primary zone. Dual-season coverage.
- Crops: Winter Wheat, Spring Wheat
- Season: Oct–Jun (winter) / May–Aug (spring)
- Model: Separate calibration per season
Delta & Southeast Soy
Arkansas, Mississippi, Tennessee, Louisiana, Kentucky. Double-cropped soybean region with distinct growing calendar.
- Crops: Soybean
- Season: Jun – November
- Model: Delta-specific calibration
API Reference Overview
REST API with versioned JSON responses. Endpoints are organized by field-level queries, regional aggregates, and anomaly monitoring. All requests require API key authentication via Authorization: Bearer <token>. Rate limits apply per tier — Enterprise tier has no per-call limits during growing season.
/v1/fields/{field_id}/yield-estimate
Returns current yield estimate with P10/P50/P90 distribution, NDVI latest, and confidence flag.
/v1/fields/{field_id}/ndvi-series
Full NDVI time-series for the current and previous growing seasons. Array of date/NDVI pairs.
/v1/fields/batch
Submit a GeoJSON polygon collection for batch field lookup. Up to 500 fields per request.
/v1/regions/{state}/supply-estimate
State-level aggregate yield estimate. Useful for national supply trajectory modeling.
/v1/alerts/anomalies
NDVI anomaly flags for your subscribed region portfolio. Updated every 5 days during growing season.
Explore the data for your region.
Request API access specifying your crop and state coverage. Coverage confirmation and API credentials are issued within one business day. The Pilot tier covers one crop reporting district for 90 days at no cost.