From orbit to actuarial table in 5 days.
A full-stack geospatial intelligence pipeline: Sentinel-2 multispectral ingestion, atmospheric correction and temporal compositing, gradient-boosted yield modeling against USDA NASS ground truth, and REST API delivery of P10/P50/P90 field-level distributions.
Four stages. Five days. Field-level output.
Satellite Pass
Daily multispectral imagery acquisition from two constellations. 10-meter GSD. 10-band capture over CONUS cropland.
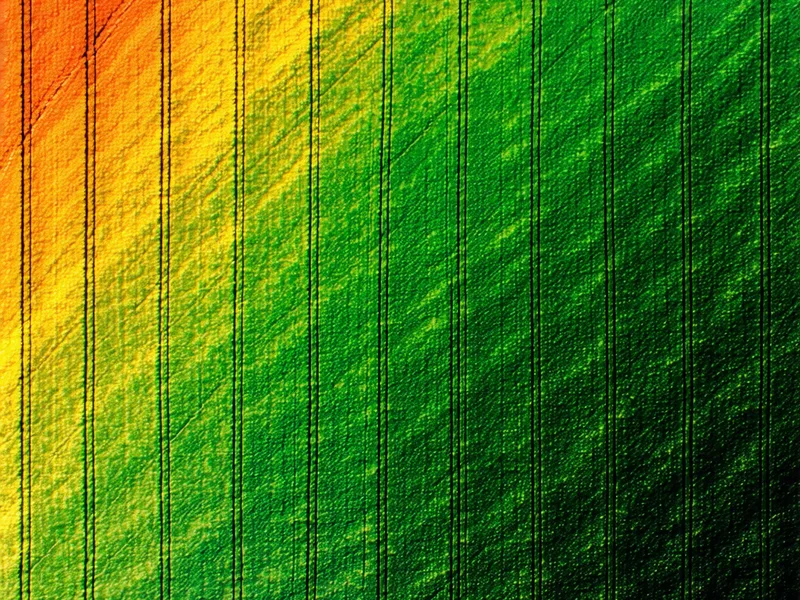
Multispectral Processing
Atmospheric correction, cloud masking, and temporal compositing. NDVI, EVI, and red-edge band ratio computation.
Yield Model
Gradient-boosted models ingest NDVI time-series, growing-degree days, and soil moisture. Output: P10/P50/P90 field distributions.
API Output
REST API delivery. GeoJSON field polygons, NDVI time-series, probability distributions. Updated every 5 days.
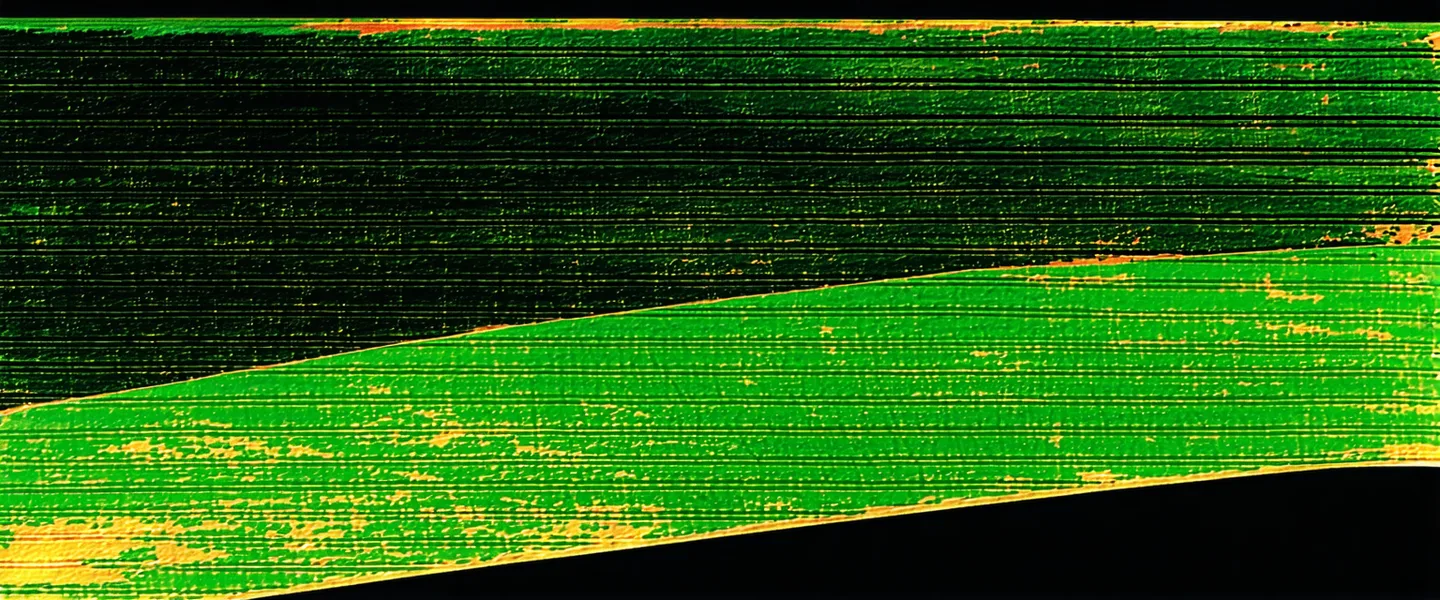
10-Meter Multispectral Imagery
Terraxiq ingests 10-band multispectral imagery from two satellite constellations. Band configuration: Blue, Green, Red (10m), Near-Infrared (10m), Red-Edge (20m upsampled to 10m), SWIR-1 and SWIR-2 (20m upsampled). Radiometric calibration to surface reflectance using Sen2Cor-class atmospheric correction pipeline.
Cloud masking and temporal compositing run on 15-day rolling windows, selecting the minimum-cloud-cover observation per pixel and filling residual cloud gaps with weighted multi-day Sentinel-2 passes. The result: a clean, 5-day composite NDVI surface even during peak cloud-cover months in the US Corn Belt (June–July).
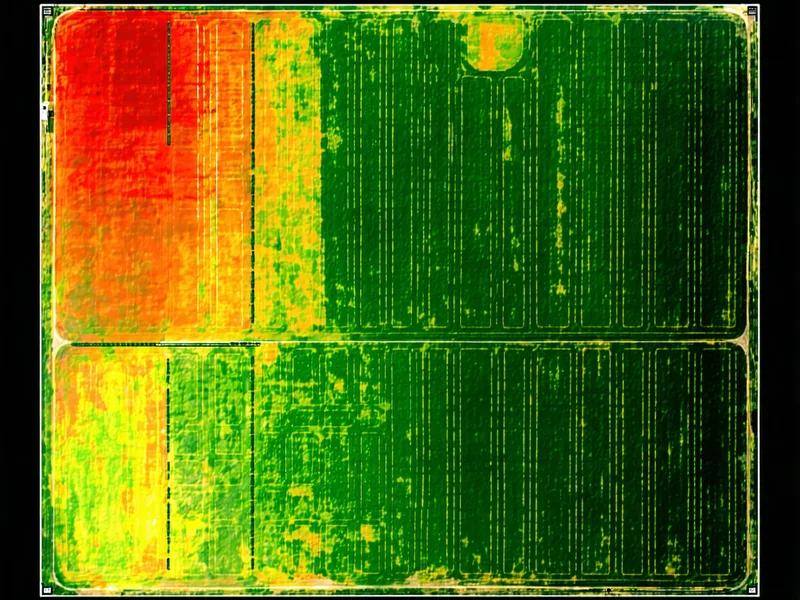
Field-Level Yield Models
Gradient-boosted ensemble models (XGBoost with seasonal feature sets) ingest NDVI time-series, Enhanced Vegetation Index (EVI), red-edge chlorophyll indices, growing-degree day accumulation (GDD base 50°F for corn), soil moisture anomaly from SMAP-derived estimates, and precipitation deviation from 20-year normals.
Calibrated using leave-one-county-out cross-validation against 8 years of USDA NASS county yield surveys. Models are re-calibrated each spring before planting-season emergence. Output: P10/P50/P90 yield distributions per field polygon in bushels per acre, updated every 5 days from V5 vegetative stage through R6 physiological maturity.
REST API + GeoJSON Delivery
Typed, versioned, documented. No ESRI toolchain required on the buyer's side.
Field polygon boundaries (CLU-matched GeoJSON), NDVI time-series arrays, yield probability distributions, and anomaly flags delivered via REST endpoint. Response schema is designed for direct ingestion into Majesco, Guidewire, and custom actuarial rating engines, as well as Python/R quant trading workflows. Authentication via Bearer token with per-endpoint rate limiting.
Explore the API Docs{
"field_id": "field_ia_2847_corn",
"as_of": "2025-07-15",
"crop": "corn",
"centroid": [-93.471, 42.006],
"ndvi_latest": 0.742,
"yield_bu_ac": {
"p10": 168,
"p50": 194,
"p90": 217
},
"confidence": "high"
}Technical Specifications
| Image Resolution | 10 meters GSD |
| Revisit Frequency | 5-day composite |
| Spectral Bands | 10 (VIS, NIR, RE, SWIR) |
| Coverage | Continental US (CONUS) |
| Crops Supported | Corn, Soybean, Winter/Spring Wheat |
| Output Format | GeoJSON, GeoTIFF, CSV |
| Update Cadence | Every 5 days, growing season |
| API Protocol | REST / HTTPS, JSON |
| SLA Uptime | 99.5% during growing season |
Start with a data trial.
Evaluate Terraxiq against your existing county-average loss cost factors in a single crop reporting district. One growing season. Compare field-level P50 estimates to USDA NASS actuals at harvest.